120 scorers · 3 domains · 1 number
The market,scored.
StocksScores runs 120 mathematical scorers across technicals, fundamentals, and news sentiment — then compresses them into a single 0–100 bullishness score for every stock. Transparent, drillable, and tuned nightly against real forward returns.
Free on every analysis page · No credit card · Cancel anytime
Every ticker,
one screen.
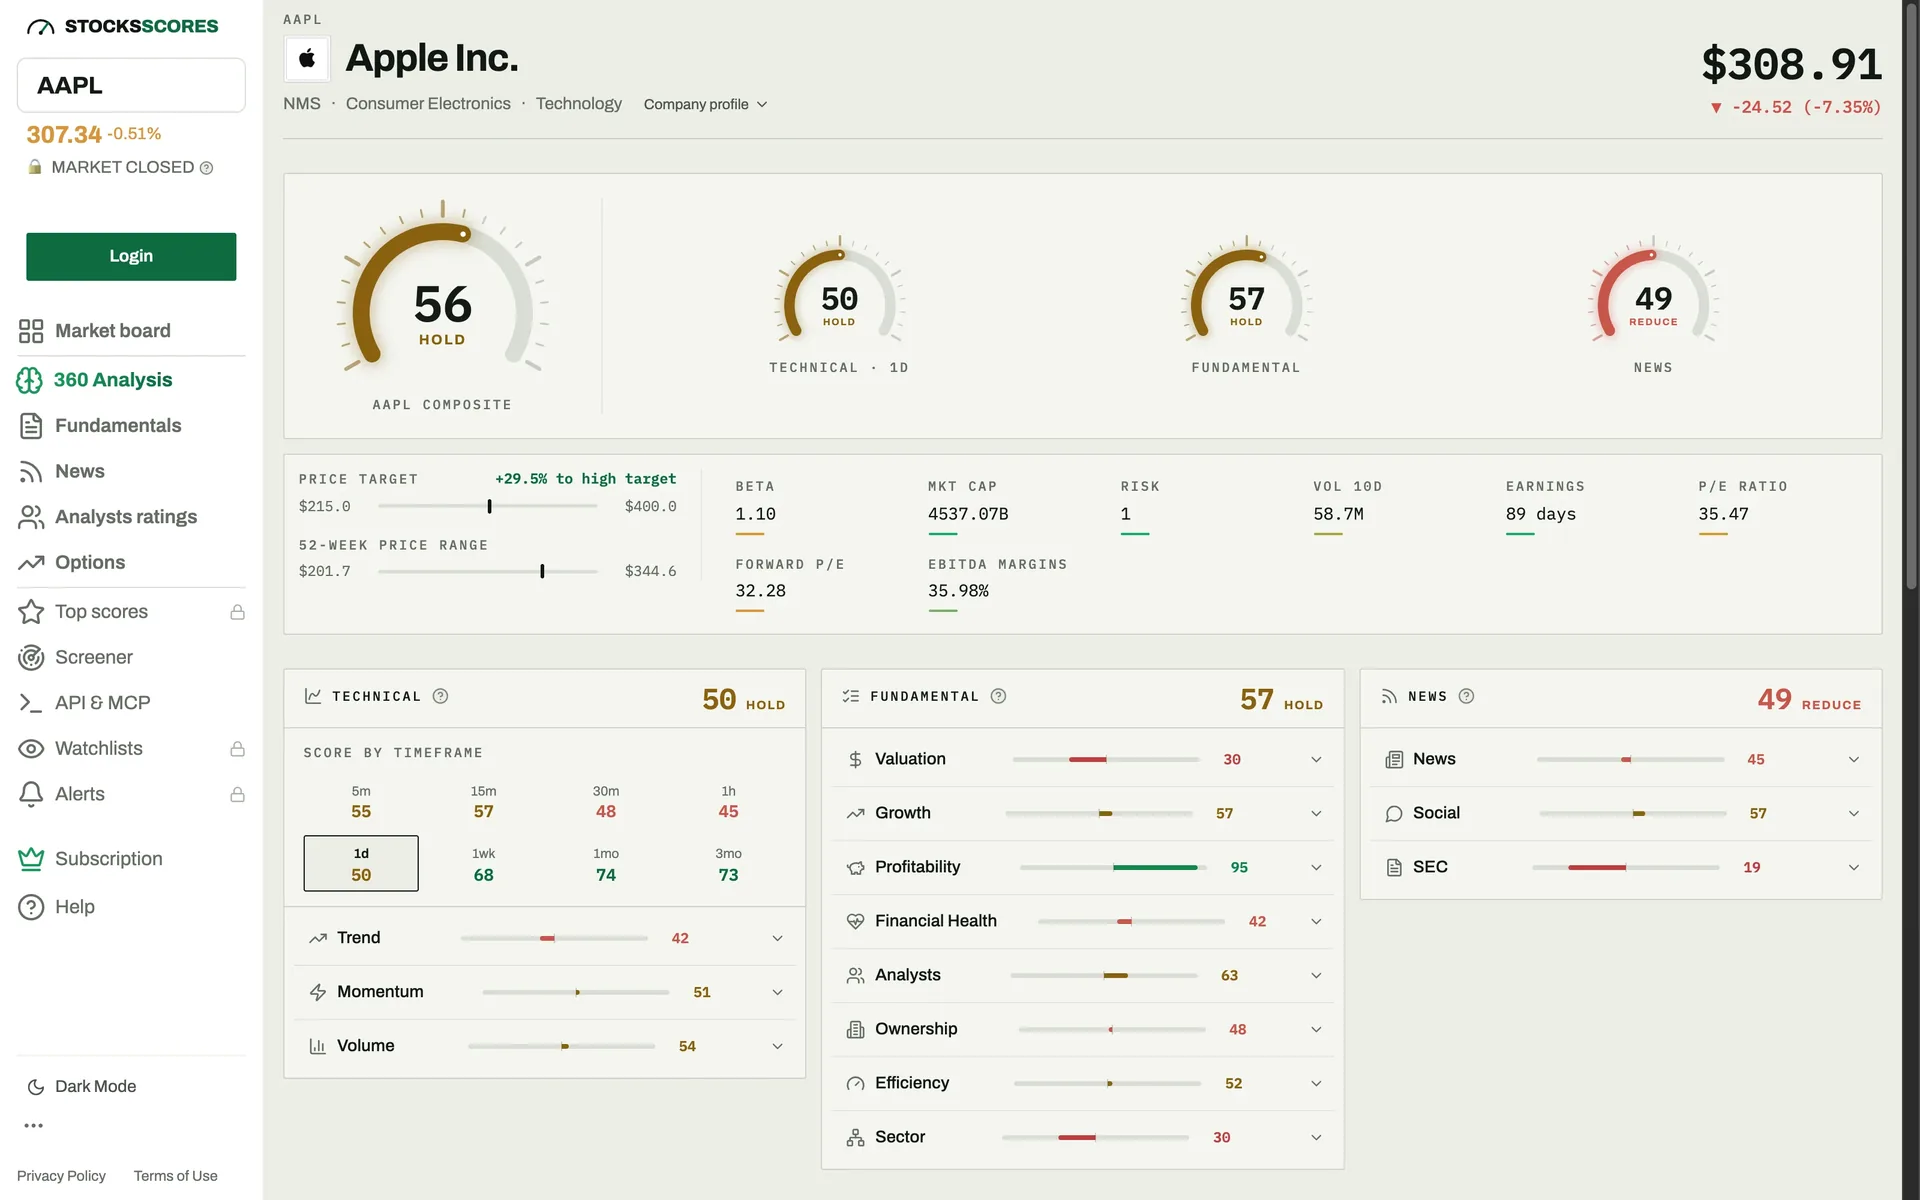
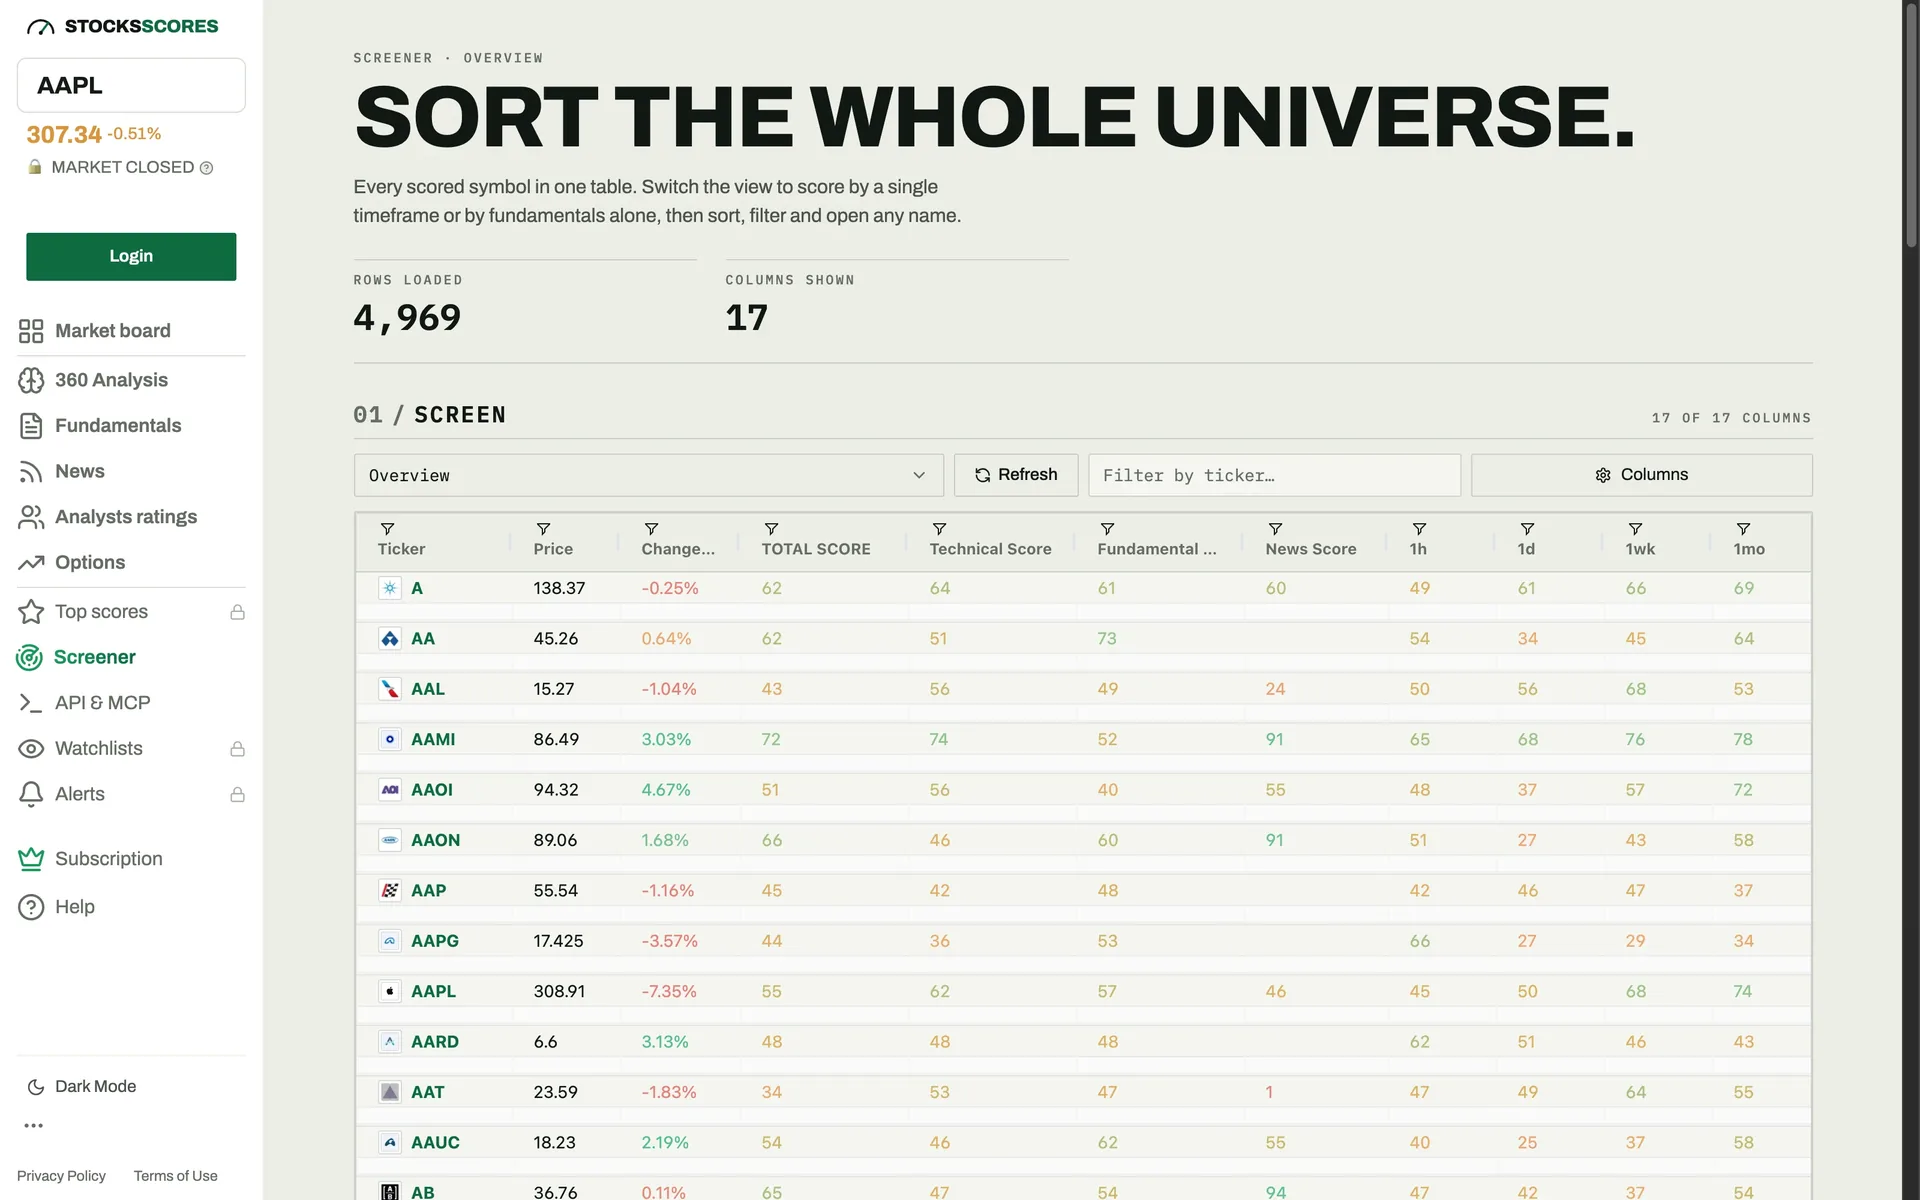
Technical and fundamental dials roll up into a grand total, with news shown beside them. Every sub-score is drillable — see exactly which of the 120 scorers pushed the number up or dragged it down.
Technical
01/03SMA, RSI, MACD, Ichimoku and more — per interval, 2m to 3mo, weighted toward the daily.
Fundamental
02/03P/E, ROIC, growth, insider and congressional activity — scored against curated sector ranges.
News
03/03Article and social sentiment, SEC filings, analyst moves — processed continuously.
50,000 inputs.
One verdict.
No black boxes and no vague signals — a transparent, auditable pipeline from raw data to a single actionable score.
Prices, financials, SEC filings, earnings calls, congressional disclosures, social sentiment — fetched in parallel for every ticker.
Each scorer returns 0–100, higher is more bullish. Missing data returns null — a score is never manufactured.
Per-interval weighted averages roll up into technical, fundamental, and news totals. Daily-weighted, sector-aware.
Technical and fundamental at equal weight; news is shown beside it, not counted. Every sub-score underneath stays drillable, so the verdict is always auditable.
120 opinions.
One number.
Every scorer is a mathematical rule with a name, a formula, and a 0–100 output. Here is a slice of the committee — each one drillable inside the app.
- SMA 50×200
- EMA 12×26
- RSI 14
- MACD
- Ichimoku Cloud
- Bollinger Bands
- Stochastic
- ADX Trend
- ATR Volatility
- OBV Flow
- CCI
- Williams %R
- Parabolic SAR
- Aroon
- MFI
- ROC Momentum
- Engulfing
- Hammer
- Morning Star
- Three Soldiers
- Doji Reversal
- Volume Surge
- + more in the app
- P/E vs Sector
- Forward P/E
- PEG Ratio
- Price/Book
- Debt/Equity
- ROIC
- ROE
- Gross Margin
- Operating Margin
- Revenue Growth
- EPS Growth
- FCF Yield
- DCF Fair Value
- Analyst Consensus
- Price Target Gap
- Insider Buys
- Congressional Trades
- Institutional Flow
- Dividend Safety
- + more in the app
- Article Sentiment
- Social Sentiment
- News Volume
- SEC Filings
- Earnings Call Tone
- Analyst Revisions
- Buzz Momentum
- Headline Risk
- + more in the app
Built like a
research desk.
Most tools show you data and leave the interpretation to you. This one does the synthesis — and shows its work.
120 mathematical scorers
Technical indicators, fundamental ratios, and news sentiment — each dissected into an individual 0–100 scorer. Higher is more bullish, and every one is drillable.
Eight timeframes, weighted
Technical scores run per interval from 5 minutes to 3 months, then weight-average across timeframes. Daily dominates; intraday adds precision.
Sector-relative fundamentals
A P/E of 25 means something different for Tech than for Energy. Curated ranges for 14 sectors and industries keep every fundamental score context-aware.
Concrete trade ideas
Entry, stop-loss, take-profit, risk-reward ratio, and estimated win rate — generated per ticker. Actionable levels, not vague signals.
An analyst you can question
A read-only agent over the full market-data warehouse. Ask it to compare stocks, rank a watchlist, or chart history — it answers with real tables and charts.
Measured against reality
Every nightly score is recorded and its forward return measured against SPY, building the record the weights get tuned on.
The numbers behind the number.
- Individual scorerstechnical · fundamental · news
- 120
- Score rangehigher is more bullish
- 0–100
- Timeframes5 minutes to 3 months
- 8
- Sectors calibratedcurated fundamental range sets
- 14
- Data points per stockfetched in parallel
- 50,000+
- Scored nightlyUS stocks, every score recorded
- 4,000+
- Score domainstechnical + fundamental counted
- 3
- Languagesinterface; English complete
- 6
Every score,
over plain HTTP.
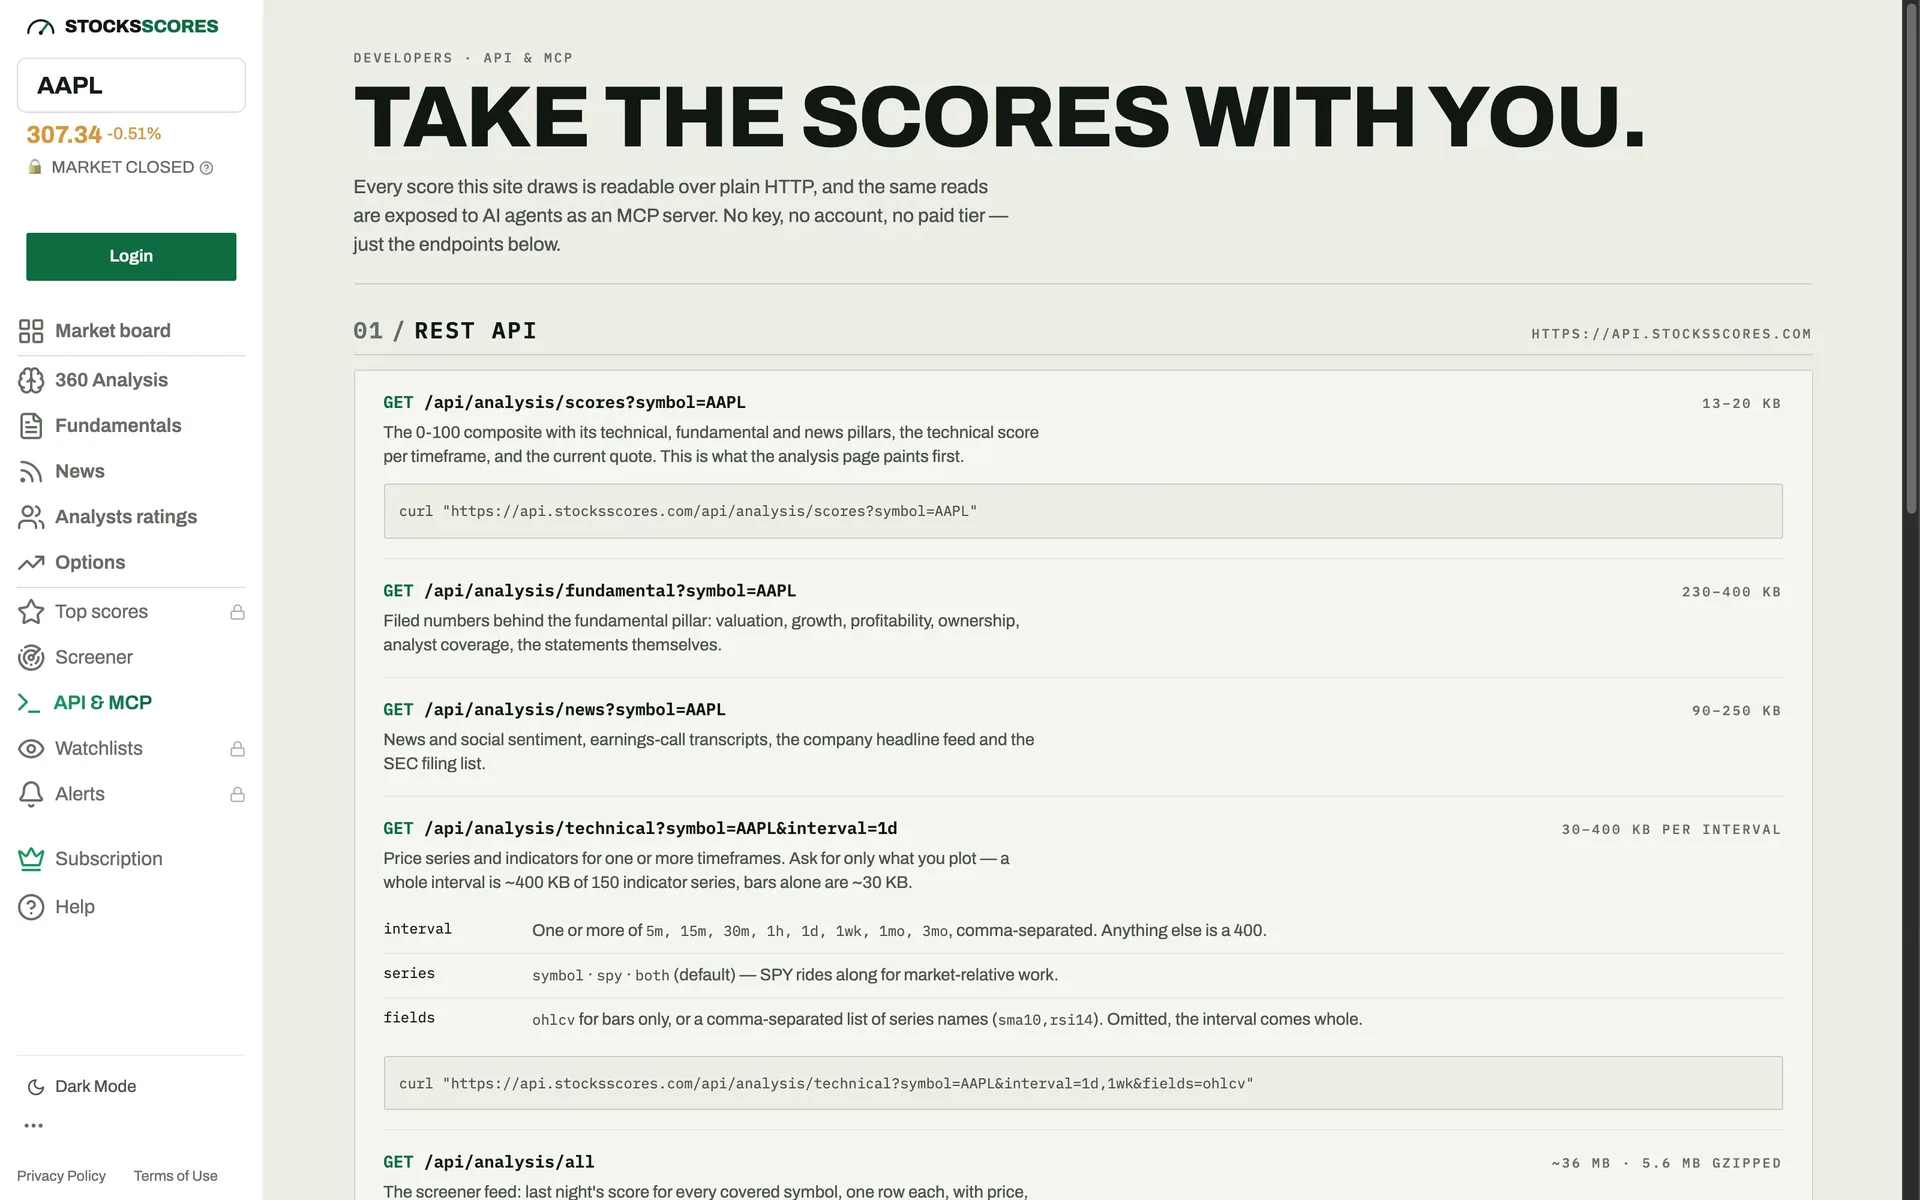
The same reads the app draws are public REST endpoints — and the same reads again as an MCP server, so an AI agent can ask for them by name. No key, no account, no paid tier.
REST API
https://api.stocksscores.com- /api/analysis/scores?symbol=AAPL
- Composite, three pillars, per-timeframe technicals, quote.
- /api/analysis/fundamental?symbol=AAPL
- Valuation, growth, profitability, ownership, the statements.
- /api/analysis/news?symbol=AAPL
- News and social sentiment, earnings calls, SEC filings.
- /api/analysis/technical?symbol=AAPL&interval=1d
- Price series and 150 indicator series, per timeframe.
- /api/analysis/all
- The screener feed — last night's score for every covered symbol.
MCP server
https://api.stocksscores.com/mcpStreamable HTTP, nothing to install. Point any MCP client at the URL and ask in plain language.
claude mcp add --transport http stocksscores https://api.stocksscores.com/mcp- get_stock_analysis
- Scores one symbol.
- screen_stocks
- Filters the universe by score band and sector.
- top_scores
- The highest scoring symbols right now.
From the desks running it.
“I used to check 15 different indicators before entering a trade. Now I look at one number. The drilldown means I can still geek out on the RSI or MACD if I want — but the grand total is all I need to pull the trigger.”
“The sector-relative fundamental scoring is what sold me. A P/E of 25 scored differently for a tech stock than an energy stock — that's the nuance most retail tools completely miss.”
“The trade ideas are concrete — entry, stop-loss, take-profit, risk-reward. Not vague 'buy signals.' I can hand these to clients and explain the thesis behind each one.”
“Congressional trading data in the fundamental scores. Insider transaction sentiment. That's alpha most people don't even know exists, let alone have scored 0–100 for them.”
“I don't understand RSI or Ichimoku clouds. But I understand '87 out of 100.' StocksScores made the market accessible to me without dumbing it down.”
Start free.
Stay free, if you like.
The full analysis page costs nothing, forever. Premium unlocks the analyst, the screener, trade ideas, portfolios, and alerts — with a 7-day trial and no card up front.
Free
The full analysis page. No credit card, no sign-up.
- Full stock analysis page — included
- 120 scorers + grand total — included
- Options chains + AI ideas — included
- News, fundamentals, analyst ratings — included
- AI analyst chat — not included
- Screener + top scores — not included
- Portfolios, watchlists, alerts — not included
Premium
Most popularEverything, unlimited. 7-day free trial.
- Everything in Free — included
- AI analyst chat — included
- Stock screener + top scores — included
- AI trade ideas (entry / exit / stop) — included
- Portfolios, watchlists, price alerts — included
- Custom weight presets — included
- Alpaca trading integration — included
Enterprise
For teams and institutions.
- Everything in Premium — included
- Custom AI models — included
- Custom integrations + API — included
- On-premise deployment — included
- Dedicated account manager — included
- SLA guarantee — included
- Priority support — included
30-day money-back guarantee · No questions asked
Questions, answered.
Everything you need to know about the scoring engine. Anything else — write to us, we respond fast.
An equal-weight blend of two domain totals built from 120 individual scorers: technical (RSI, MACD, SMA, Ichimoku and more) and fundamental (P/E, ROIC, sector percentile, insider trading and more). A third domain, news (sentiment, SEC filings, social buzz), is scored and shown but not counted. Each scorer returns 0–100 where higher is more bullish. The grand total is one number you can act on.
Screeners show you data and leave you to interpret it. StocksScores computes 120 mathematical scorers that each return a 0–100 bullishness score, then weight-aggregates them into one number. You're not looking at 50 indicators — you're reading the synthesized verdict of all of them.
Yahoo Finance (financials, historical prices, analyst recommendations), Finnhub (news sentiment, social sentiment, SEC filings, congressional trading, insider transactions), Alpha Vantage (news feed, earnings call transcripts), and TA-Lib for all technical indicator computation. 50,000+ data points per stock.
Yes. The full analysis page is free forever — no sign-up required. You get the complete scoring breakdown for any stock. Premium features (AI analyst chat, screener, trade ideas, portfolios, alerts, custom weights) are free for 7 days, no credit card to start.
An analysis is computed when you open it and cached for up to two hours, so technical scores across 8 timeframes (5 minutes to 3 months) follow the market through the day. Fundamental scores move as new data arrives — earnings, SEC filings, analyst ratings. The whole universe is also rescored every night.
No. It's an agent with read-only access to the full market-data warehouse. It can run SQL queries, fetch live prices, pull balance sheets, compute sentiment, and render charts, tables, and diagrams. It keeps conversation memory and can be seeded with the stock you're currently analyzing.
The verdict
Run the number
yourself.
Pick any ticker. Watch 120 scorers compress 50,000 data points into one number — free, no sign-up, right now.
Free on every analysis page · No credit card